When we first launched JavaScript Quest, the dashboard was the part I was most excited about… and also the most frustrated with.
I wanted it to feel like opening your inventory screen in a game — immediate, satisfying, full of visual goodies. But instead, it felt like waiting for a loading screen on hotel Wi-Fi.
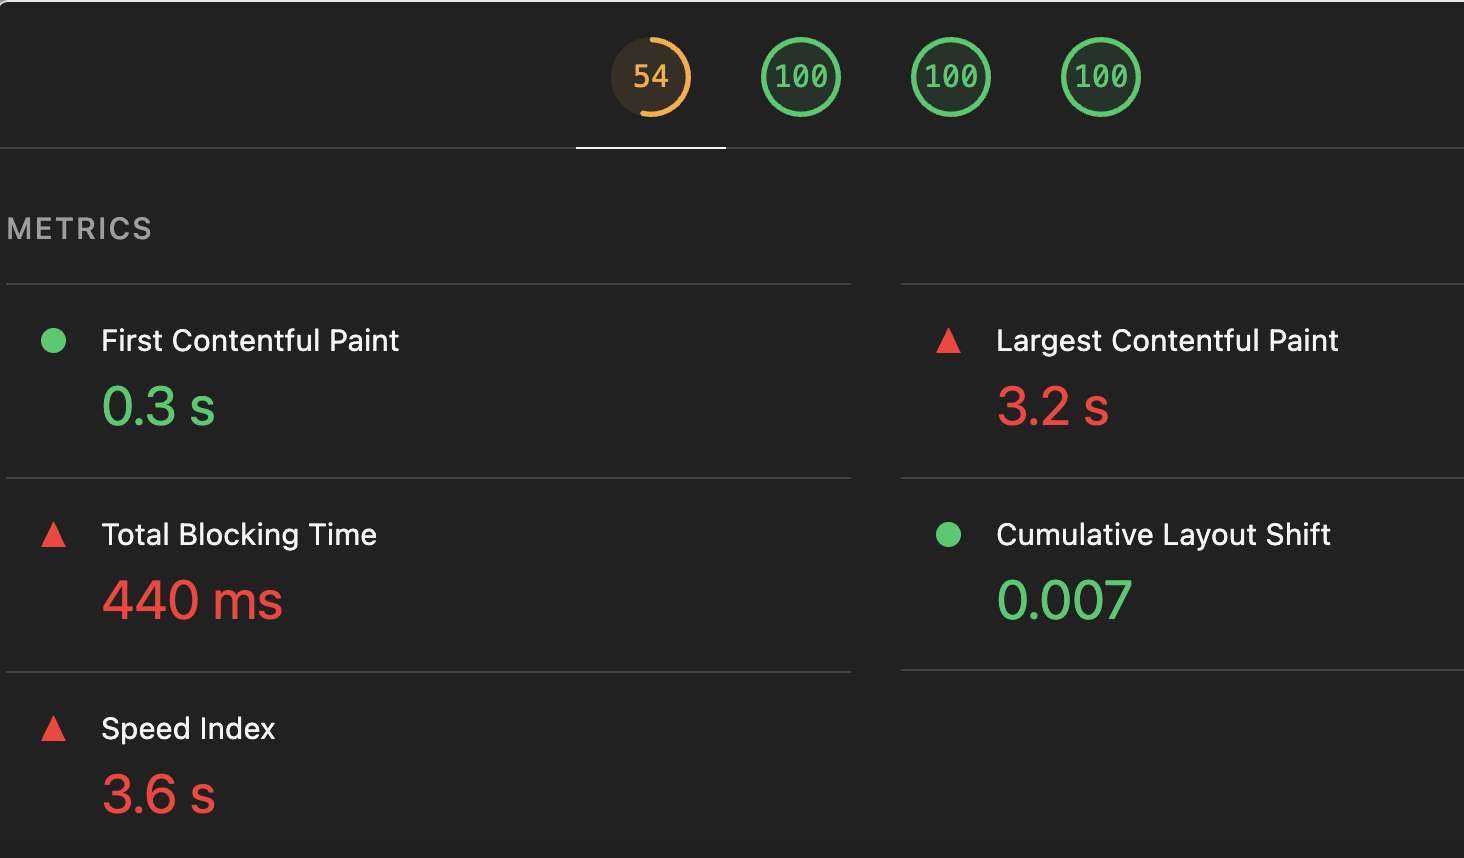
Our Lighthouse score told the same story:

- Performance Score: 54
- Largest Contentful Paint (LCP): 3.2s
- Speed Index: 3.6s
- Total Blocking Time: 440ms
The moment I saw those numbers, I knew I had to go deeper. I put on my debugging cloak, poured a second iced coffee, and set off on a performance optimization quest.
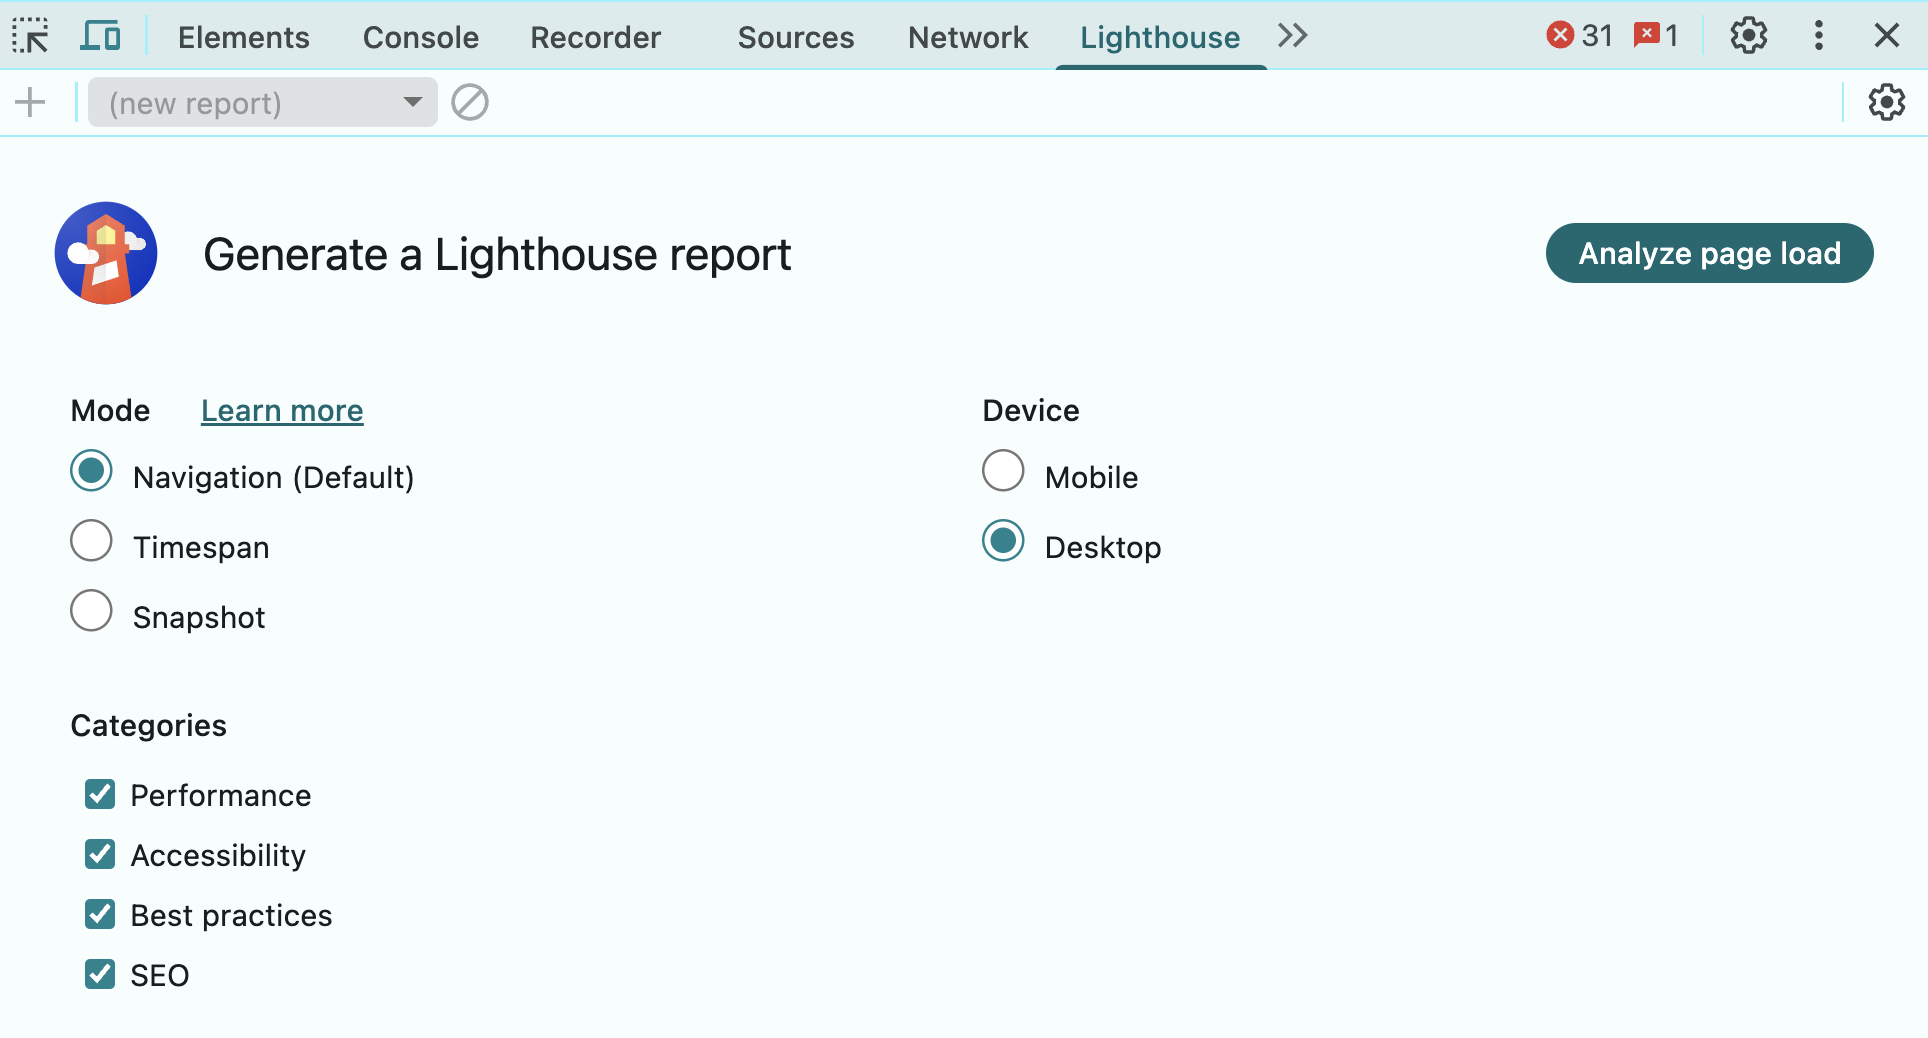
💡 Side Note: To run Lighthouse analysis on your page, open the dev tools in Chrome, navigate to the Lighthouse tab, and click on "Analyze page load." Make sure to do this in an incognito window, because browser extensions may impact the score.

Why the Dashboard Exists
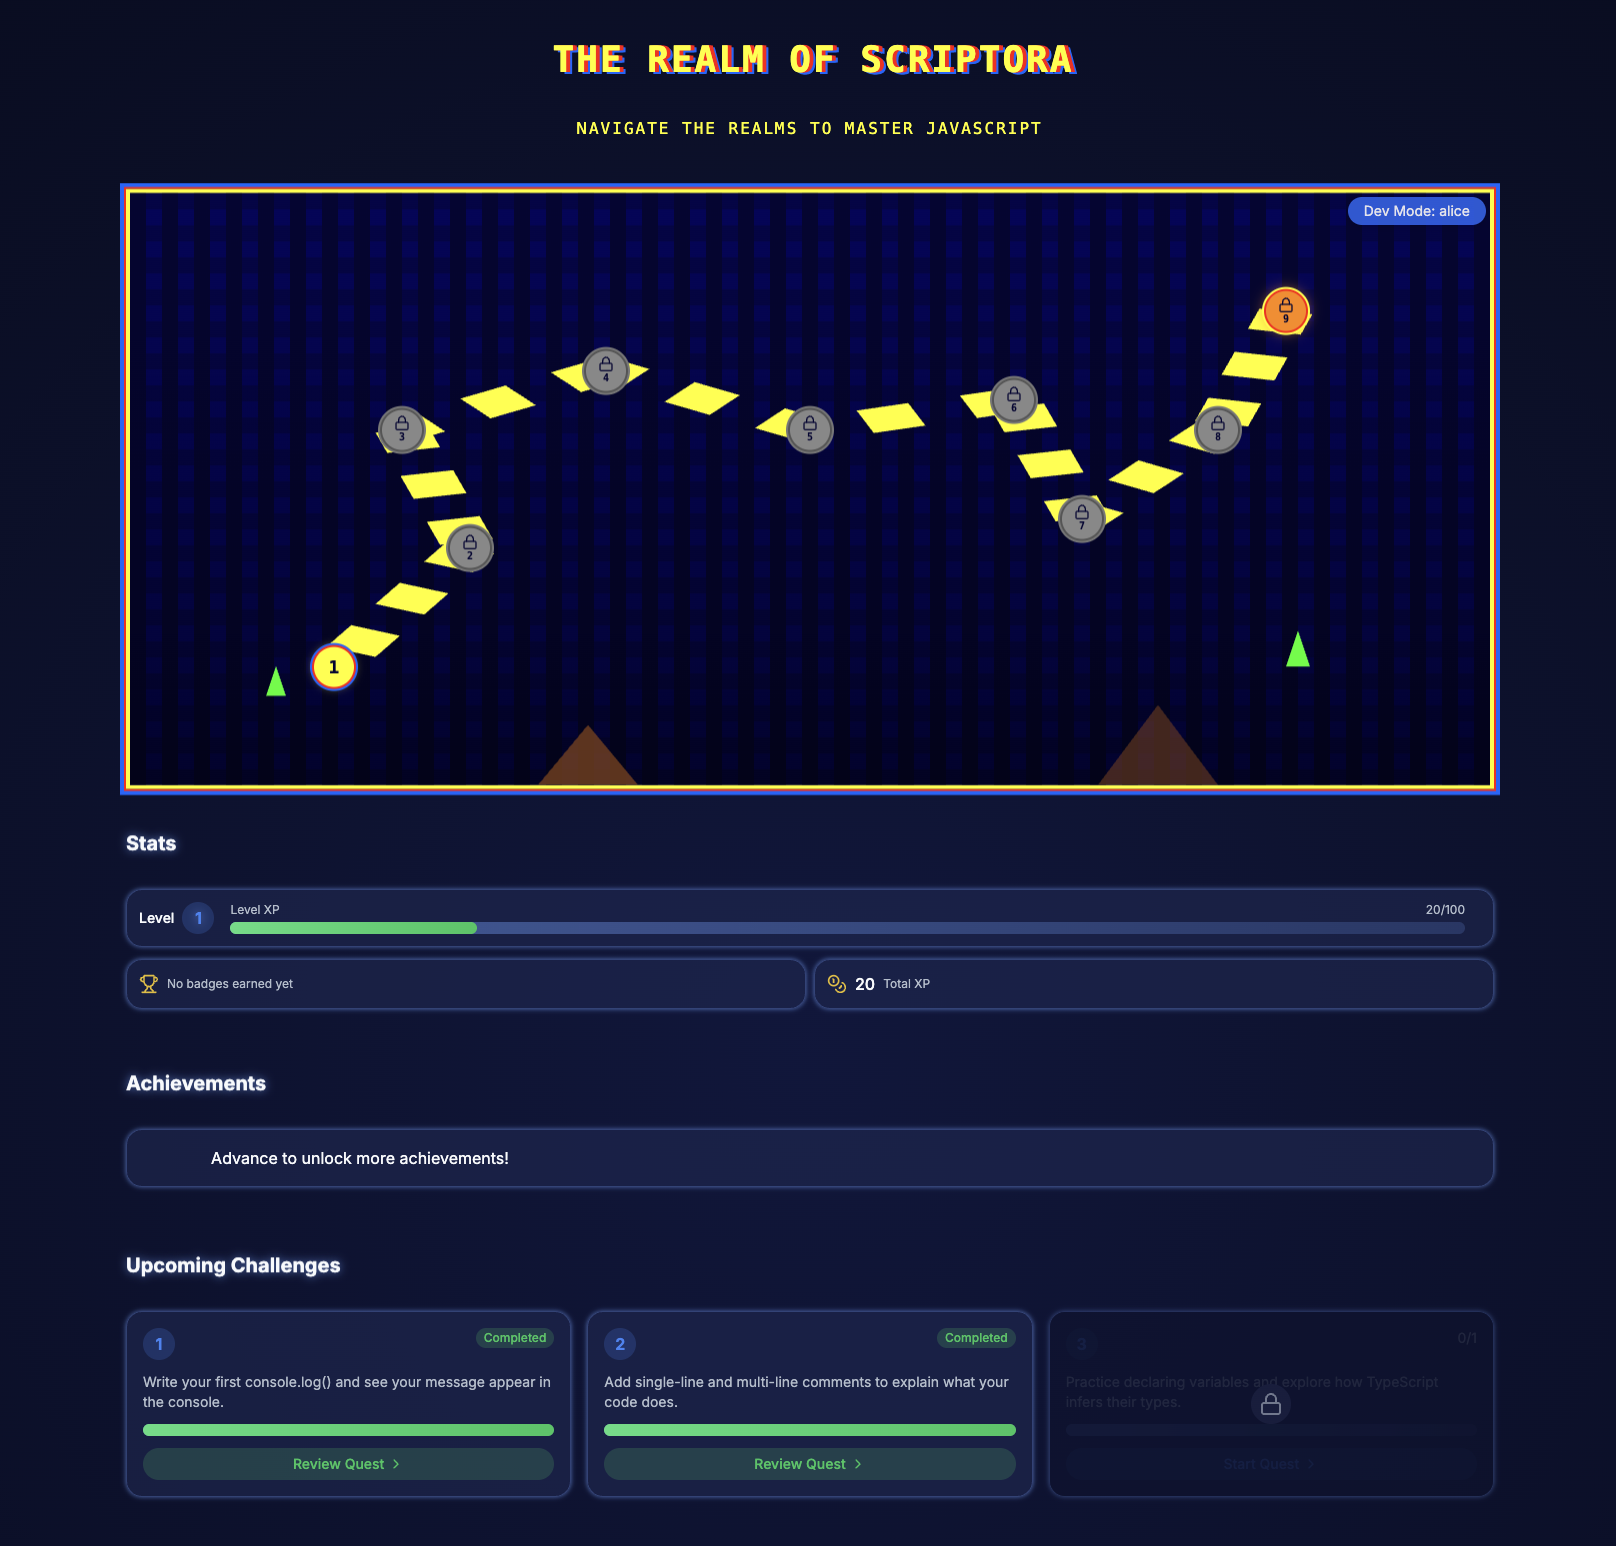
In JavaScript Quest, the dashboard is more than a stats page — it’s the player’s home base.

- Track XP, level, and skill progress
- Display achievements and badges
- See which worlds are unlocked and what’s next
- Jump back into challenges
It’s the heartbeat of the whole experience. So it had to be fast, beautiful, and fun to explore.
The Pain Points
Here’s what wasn’t working:
- The first load was painfully slow. We were fetching data on the client and showing the loading box component while it loaded.
- Perceived performance was awful. Even after moving to SSR, we had waterfalls of fetch requests.
- The dashboard wasn’t reactive — progress updates required refreshes.
I wanted the page to load instantly, so that the user would not detect a delay. Even if that meant just loading the most essential components first.
The Core Architecture
The dashboard is built using Next.js App Router, React Query, and Prisma. Each tool plays a specific role:
- Next.js gives us server-side rendering and routing out of the box
- React Query handles data fetching and caching
- Prisma connects us to the database for user progress, badges, and XP
But what really makes the dashboard feel fast is how we handle data prefetching on the server — before the page even reaches the browser.
Server-Side Data Prefetching
In a typical React app, data is fetched on the client after the page loads, which often leads to a noticeable delay — users are stuck staring at a loading spinner before any real content appears. In our case, that delay stretched beyond 3 seconds, leaving a poor first impression.
To fix this, we moved data fetching to the server, so the page is rendered with the data already in place. Here's how that works:
Then, we wrap the client component like this:
What’s happening here?
- We create a temporary React Query cache on the server
- We call
getProfileData()and store the result in that cache - We dehydrate the cache — meaning we serialize it and pass it along with the HTML
- On the client, React Query hydrates the data immediately — no spinner, no delay
Why This Matters
This technique makes the dashboard feel instant. There’s no need to wait for another network request after the page loads, because the data is already baked in.
It also improves Lighthouse scores dramatically, especially for metrics like Largest Contentful Paint (LCP) and Time to Interactive (TTI).
Is This a Next.js Thing?
Not exclusively — this is a pattern from React Query, but Next.js makes it seamless.
Because Next.js lets us write async server components and render HTML on the server, it’s the perfect environment to use prefetching like this. The HydrationBoundary component comes from the React Query integration specifically designed for Next.js’s App Router.
Inside the DashboardClient
Once the server sends down the prefetched and dehydrated data, the DashboardClient component takes over on the client side. This component is responsible for actually rendering the dashboard interface using that data — things like XP bars, level badges, skill stats, and progress tracking.
At the heart of this is a useQuery hook from React Query:
What This Does
queryKey: How React Query identifies and caches this particular requestqueryFn: The actual function that fetches the datastaleTime: Tells React Query how long the data is considered “fresh”
Because we already prefetched and hydrated this data on the server, React Query pulls it straight from the cache without making a new network request on mount — unless the data becomes stale.
💡 Side Note: What does hydration actually mean here?
Think of hydration like "waking up" the HTML with JavaScript — so it becomes interactive without needing to re-fetch. The HydrationBoundary bridges this handoff between server-rendered data and client-side React.
Additional Optimizations
Once we had the core data flow working — fetching progress on the server and hydrating it on the client — we focused on polishing the user experience and improving performance scores like LCP, CLS, and TBT.
Server-Rendered Heading (Fixing LCP)
Lighthouse flagged the main <h1> title as the Largest Contentful Paint (LCP) element.
Problem: Our heading was inside a client component and styled with 3D effects and custom fonts, so it rendered slowly.
What We Changed:
- Moved the heading into a server component so it renders with the initial HTML
- Simplified styles to reduce font and layout complexity
- Made sure it was placed above the fold
Result: LCP dropped from 3.3 seconds to 0.3 seconds.
Lazy Loading with Suspense
To avoid loading everything at once, we split large components (like stats and achievements) using React.lazy() and wrapped them in Suspense boundaries:
Benefits:
- Reduces initial JavaScript bundle size
- Loads components only when needed
- Improves perceived performance
Deferred Hydration via mapLoaded State
The interactive map was loading slowly and causing layout shifts. We fixed this by delaying hydration of stats and cards until the map had fully loaded.
Result:
- Eliminated layout shifts
- Improved CLS and overall stability
- Created a smoother, more intentional animation flow
The Results
Before

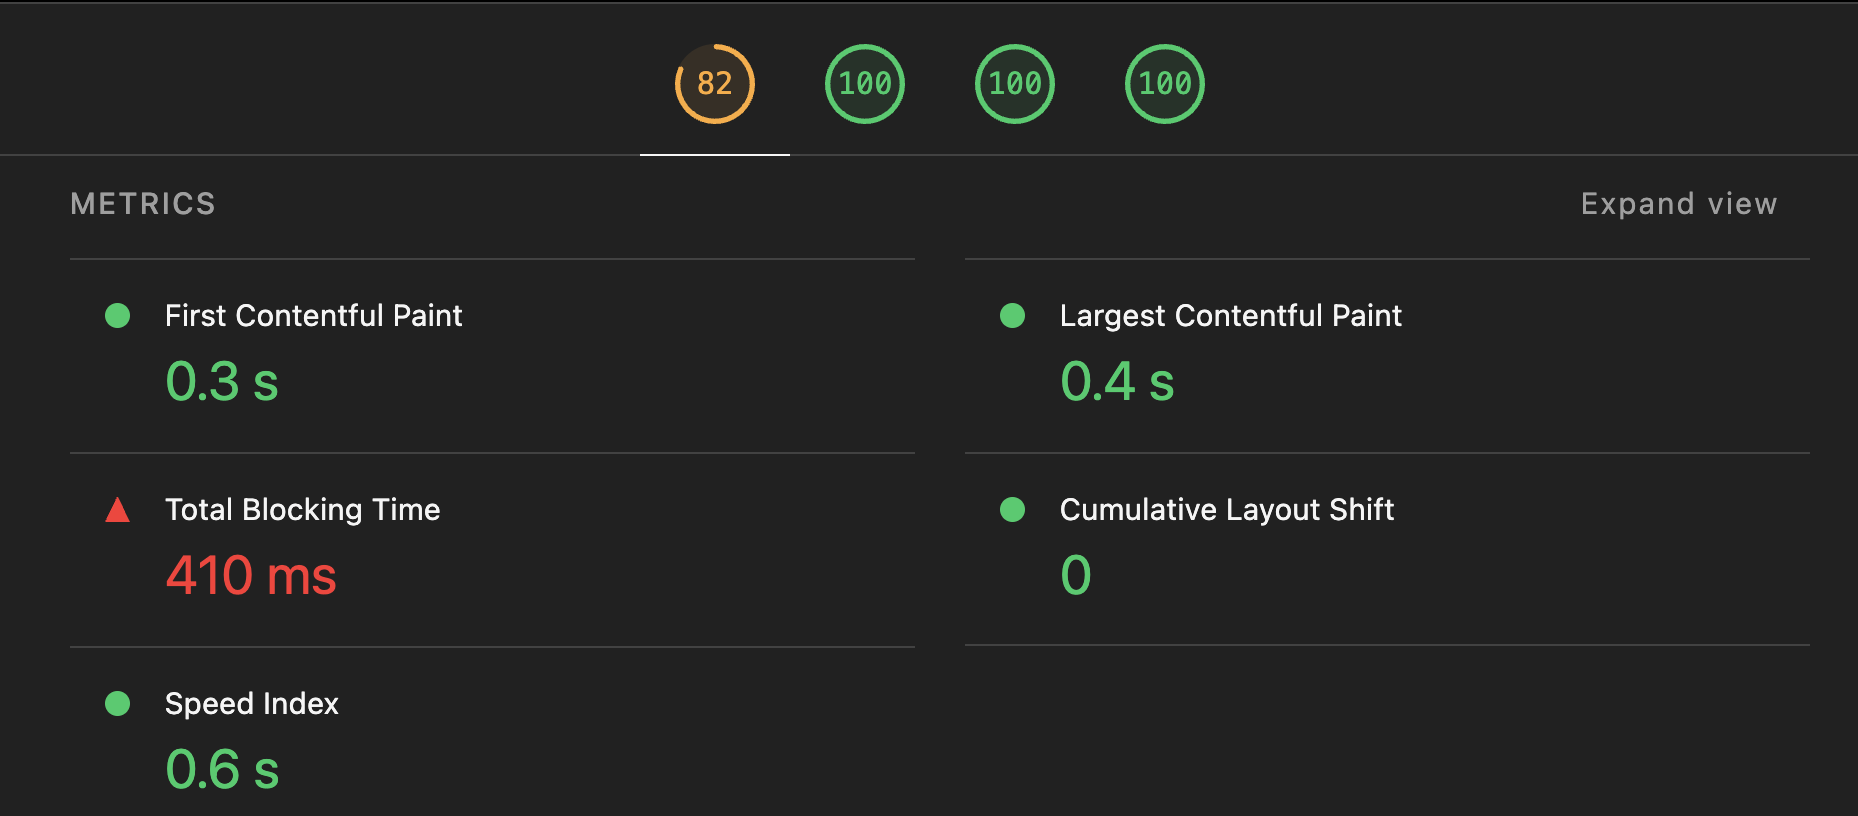
After

- The overall Lighthouse score went up by 28 points, to a final score of 82.
- The speed index went down by a full 3 seconds to a 0.6s speed index.
- The Largest Contentful Paint (LCP) went from 3.2s to 0.4s, a decrease of 87.5%.
While we still have room to improve Total Blocking Time and CSS efficiency, the current experience is smooth, fast, and polished.
If I Were Starting From Scratch…
- Use server components for all above-the-fold elements
- Skip dynamic rendering in favor of ISR + hydration
- Add React Query from the start
- Monitor your LCP elements closely
TL;DR
We transformed the JavaScript Quest dashboard from a slow-loading screen into a fast, polished player hub by making targeted performance and UX improvements:
- Server-side data hydration using React Query prefetching — no spinners, no delays
- Cached profile state with smart revalidation (60-second stale time)
- Server-rendered
<h1>to reduce LCP from 3.3s to 0.3s - Lazy loading of lower-priority components with React.lazy and Suspense
- Deferred hydration of lower sections gated by map load state
- Stable layout with zero visual shifts thanks to hydration timing and skeletons
The result: a dashboard that loads in under a second, feels responsive and game-like, and keeps players engaged.