The first time I ran Lighthouse on JavaScript Quest, I audibly groaned. A 1200ms Total Blocking Time? On a small site? Something had to be off.
Performance might seem like a problem for big apps—thousands of users, massive bundles, server strain. But I’d argue the opposite: small apps should feel instant. When they don't, it's usually because something subtle is off.
In this post, I’ll walk you through the exact tools I used to diagnose and dramatically improve the performance of JavaScript Quest, a small React + Next.js app I built. Even if you’re new to frontend development or haven’t worked with performance tools before, this guide is beginner-friendly and full of practical examples.
My Core Toolkit
If you’re just getting started, don’t worry—you don’t need to install a dozen tools. The ones below come built into your browser or are easy to set up. I used them to cut my app’s Total Blocking Time (TBT) from over 1200ms to 370ms.
Here’s what worked:
1. Lighthouse (via Chrome DevTools)
Lighthouse gives you a high-level performance score and suggestions.
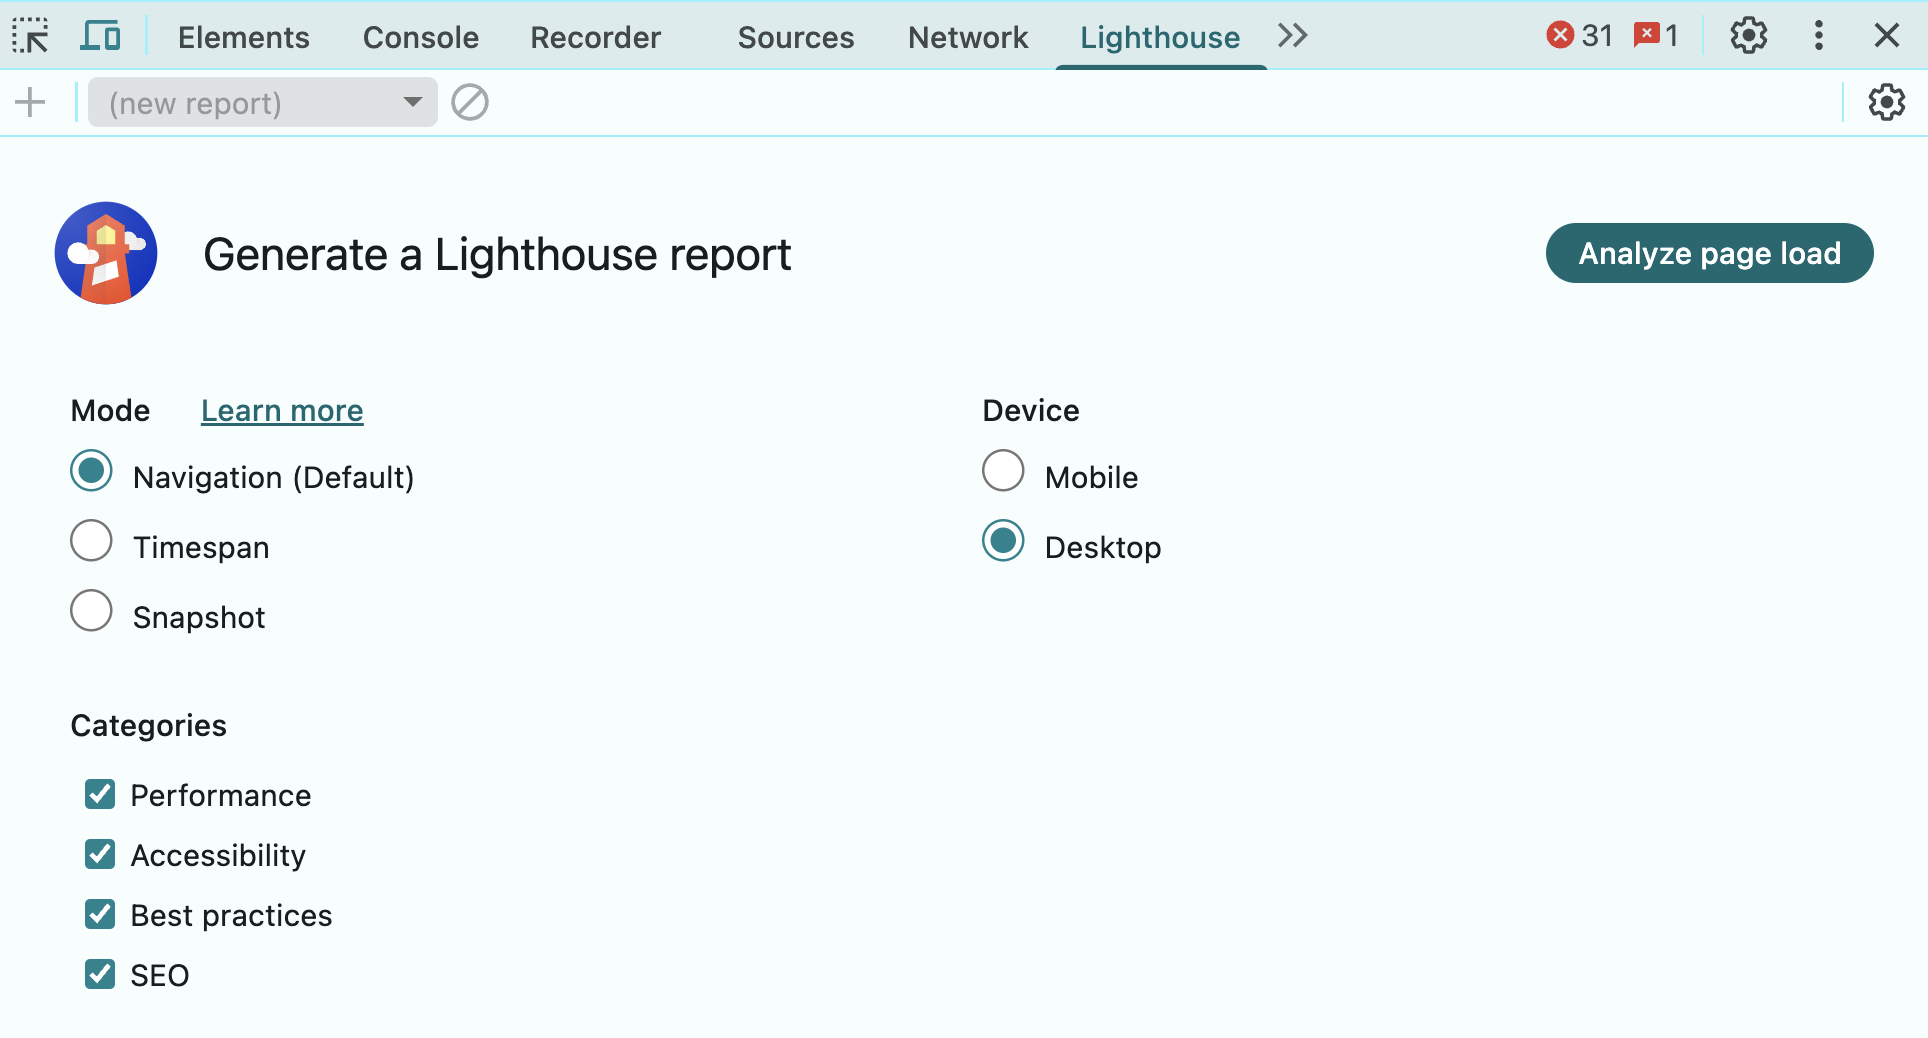
To run it:
- Open Chrome.
- Right-click → Inspect → Go to the Lighthouse tab.
- Choose Mobile or Desktop, then hit Analyze.
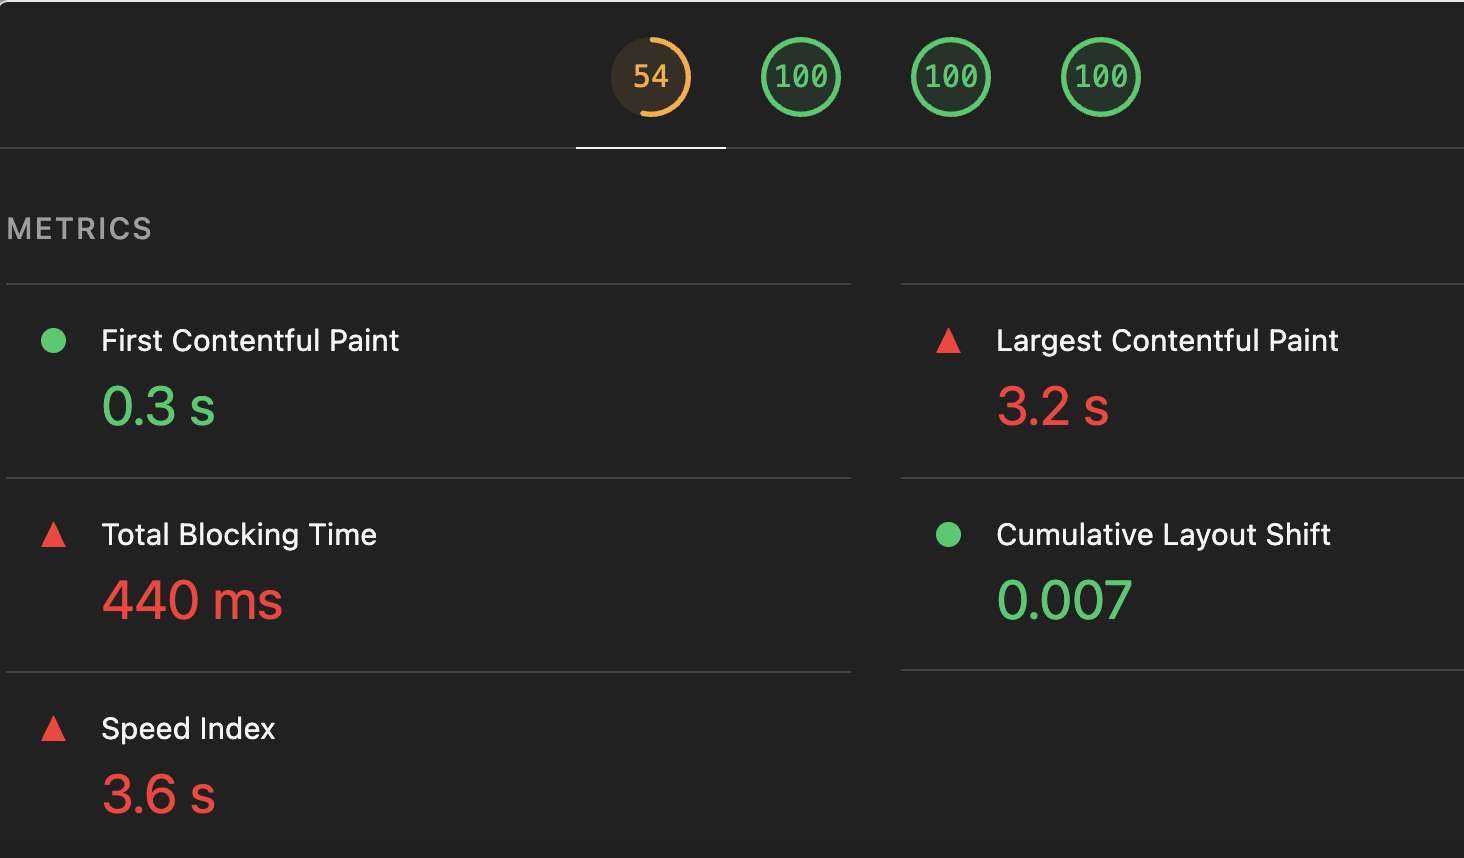
What to look at:
- LCP (Largest Contentful Paint): How fast the main content loads
- TBT (Total Blocking Time): How long the browser is unresponsive
- CLS (Cumulative Layout Shift): Are things jumping around?
I always run it in Incognito Mode to avoid browser extensions messing with the results.
2. DevTools Performance Panel
Once Lighthouse flags something, I dig deeper.
Open DevTools → Click on the Performance tab → Hit Record while the page loads or during user interactions.
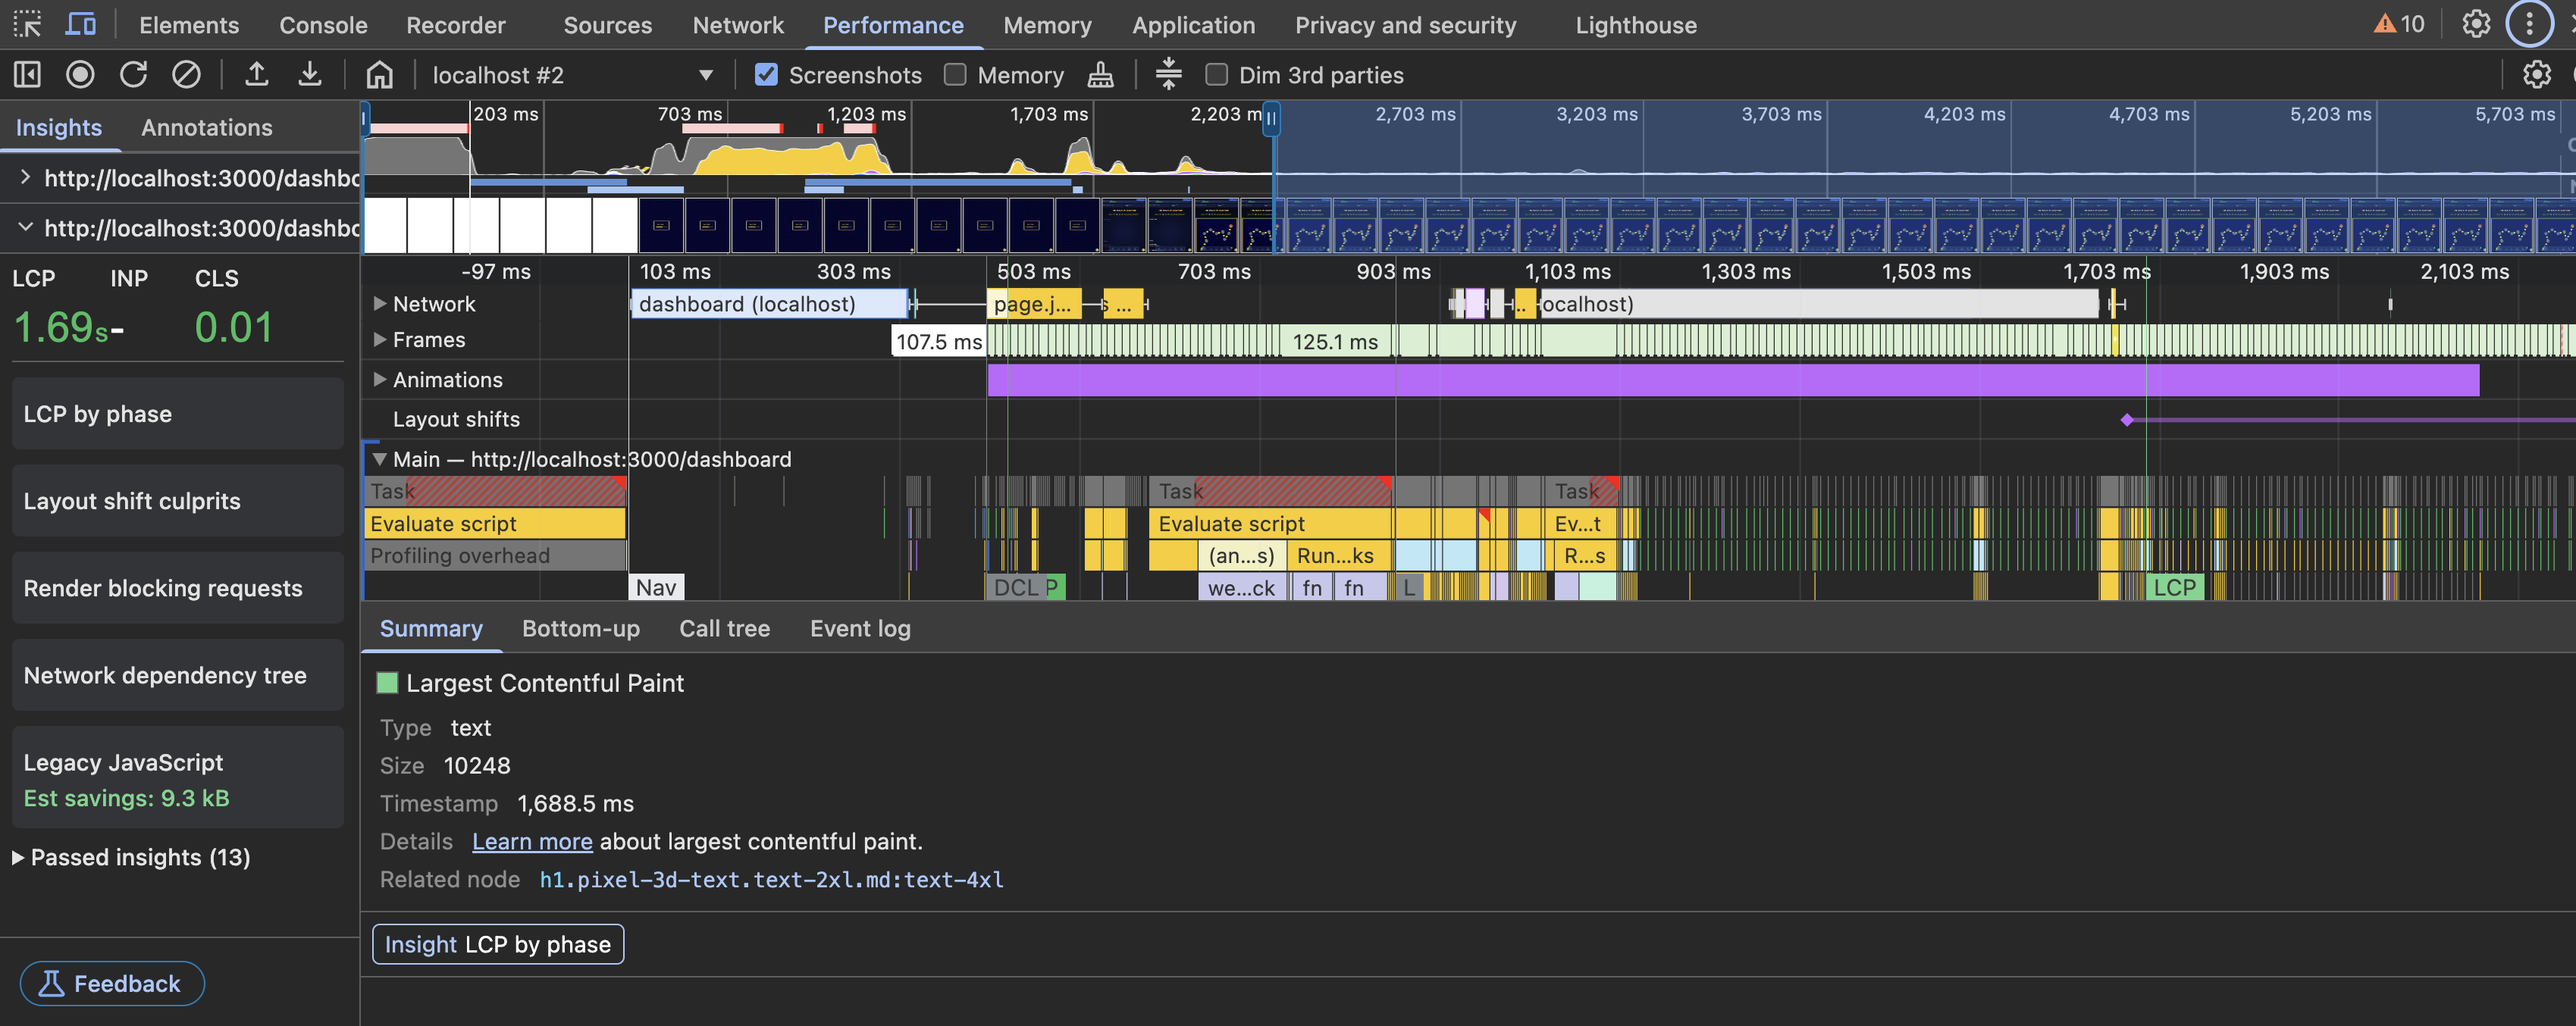
This tool shows:
- Which JavaScript files are slowing things down
- When layout and paint events are happening
- How long the browser stays busy
💡 I also use the Network tab and set it to Slow 3G to simulate a slow connection. This helps me see what real users on older phones might experience.
3. React Profiler
The React DevTools extension adds a Profiler tab to DevTools. This shows:
- Which React components rendered
- How long each one took
- If anything rendered more than necessary
I found:
- Some components were rendering twice
- Others were hydrating too early, causing visual glitches
Fixing this with requestIdleCallback and next/dynamic helped a lot.
What Those Fixes Actually Do
next/dynamic is a Next.js feature that lets you lazy-load components—so they’re only downloaded when needed. I used it to load heavy components like the code editor and intro animation only on pages that actually need them. That reduced the size of the main JavaScript bundle and sped up page load.
requestIdleCallback tells the browser: "Run this when you're not busy." I used it to delay non-critical tasks—like analytics—so the user sees the page faster.
Together, these tools helped reduce Total Blocking Time (TBT) and make the page feel snappier—especially on slower devices.
4. @next/bundle-analyzer
Think of your JavaScript bundle like a carry-on bag. Every extra kilobyte is something the browser has to unzip, organize, and wear before it can actually show the page. The bundle analyzer? It’s your TSA scanner for spotting the oversized items.
This tool shows what’s inside your production JavaScript bundles—and helps you see what shouldn’t be there.
To use it:
Add to next.config.js:
Then run:
It opens a treemap showing which files are the biggest. Here’s what I found—and how I fixed it:
What the Bundle Analyzer Revealed (and How We Fixed It)
The bundle analyzer revealed CodeMirror was being loaded on first paint. A small code editor... slowing down the whole app. That was the beginning of a fun (and slightly obsessive) optimization spree.
1. CodeMirror Was Too Heavy for First Load
What it is: CodeMirror is the text editor in our app where users write code.
The problem: We were loading the editor immediately, even when it wasn't visible.
Why it’s bad: Loading large code libraries upfront can significantly slow down the entire page, especially on mobile devices.
✅ Fix: We used something called “lazy loading” to only load CodeMirror when it’s needed.
🧠 Think of it like: Waiting to open a toolbox until you actually need the tools.
2. Sentry Was Running Too Early
What it is: Sentry helps us catch errors and slow page reports from real users.
The problem: Sentry’s performance tracking and replay tools were loading with every page, instantly.
Why it’s bad: It added background scripts and monitoring that blocked the browser from painting the page.
✅ Fix: We updated the way Sentry loads using Next.js’s instrumentation-client.ts file, and only connected user data when everything else was ready.
🧠 Think of it like: Setting up surveillance after you’ve built the house—not during construction.
3. Too Much Code in the Main File
What it is:
_app.js is like the "master layout" of a Next.js app.
The problem: We had animations and intro screens loading for every page, even if they weren’t needed.
Why it’s bad: This made our main JavaScript file huge, which hurts first load performance.
✅ Fix:
We split out the intro component using dynamic imports (next/dynamic()), so it only loads when it’s actually used.
🧠 Think of it like: Not carrying your party decorations to every meeting—only when there’s a party.
4. Pixel Styles Were Always Loading
What it is: Custom styles and graphics for our retro “Pixel World Map.”
The problem: These styles were being loaded on every page—even ones that didn’t show the map.
Why it’s bad: CSS can delay how quickly the page starts painting (FCP - First Contentful Paint).
✅ Fix:
We moved those styles to load only when the map is actually shown using import() inside useEffect().
🧠 Think of it like: Only loading your map textures when you enter the map level in a game.
5. Framer Motion Was Actually Fine
What it is: A library for animations and transitions in React.
The concern: Some animation libraries can bloat your bundle if not used carefully.
What we found: Thanks to the bundle analyzer, we confirmed it was tree-shaken properly (unused parts removed).
✅ Fix: None needed——but great to have peace of mind.
🧠 Think of it like: Double-checking your luggage is already trimmed before a flight.
🚀 Why This Matters
All of this helped reduce a performance metric called Total Blocking Time (TBT). That’s how long your app prevents people from clicking or scrolling while it’s busy loading stuff. We went from over 1200ms down to ~370ms—a massive improvement for usability.
Screenshots
Before: Big chunks in main bundle
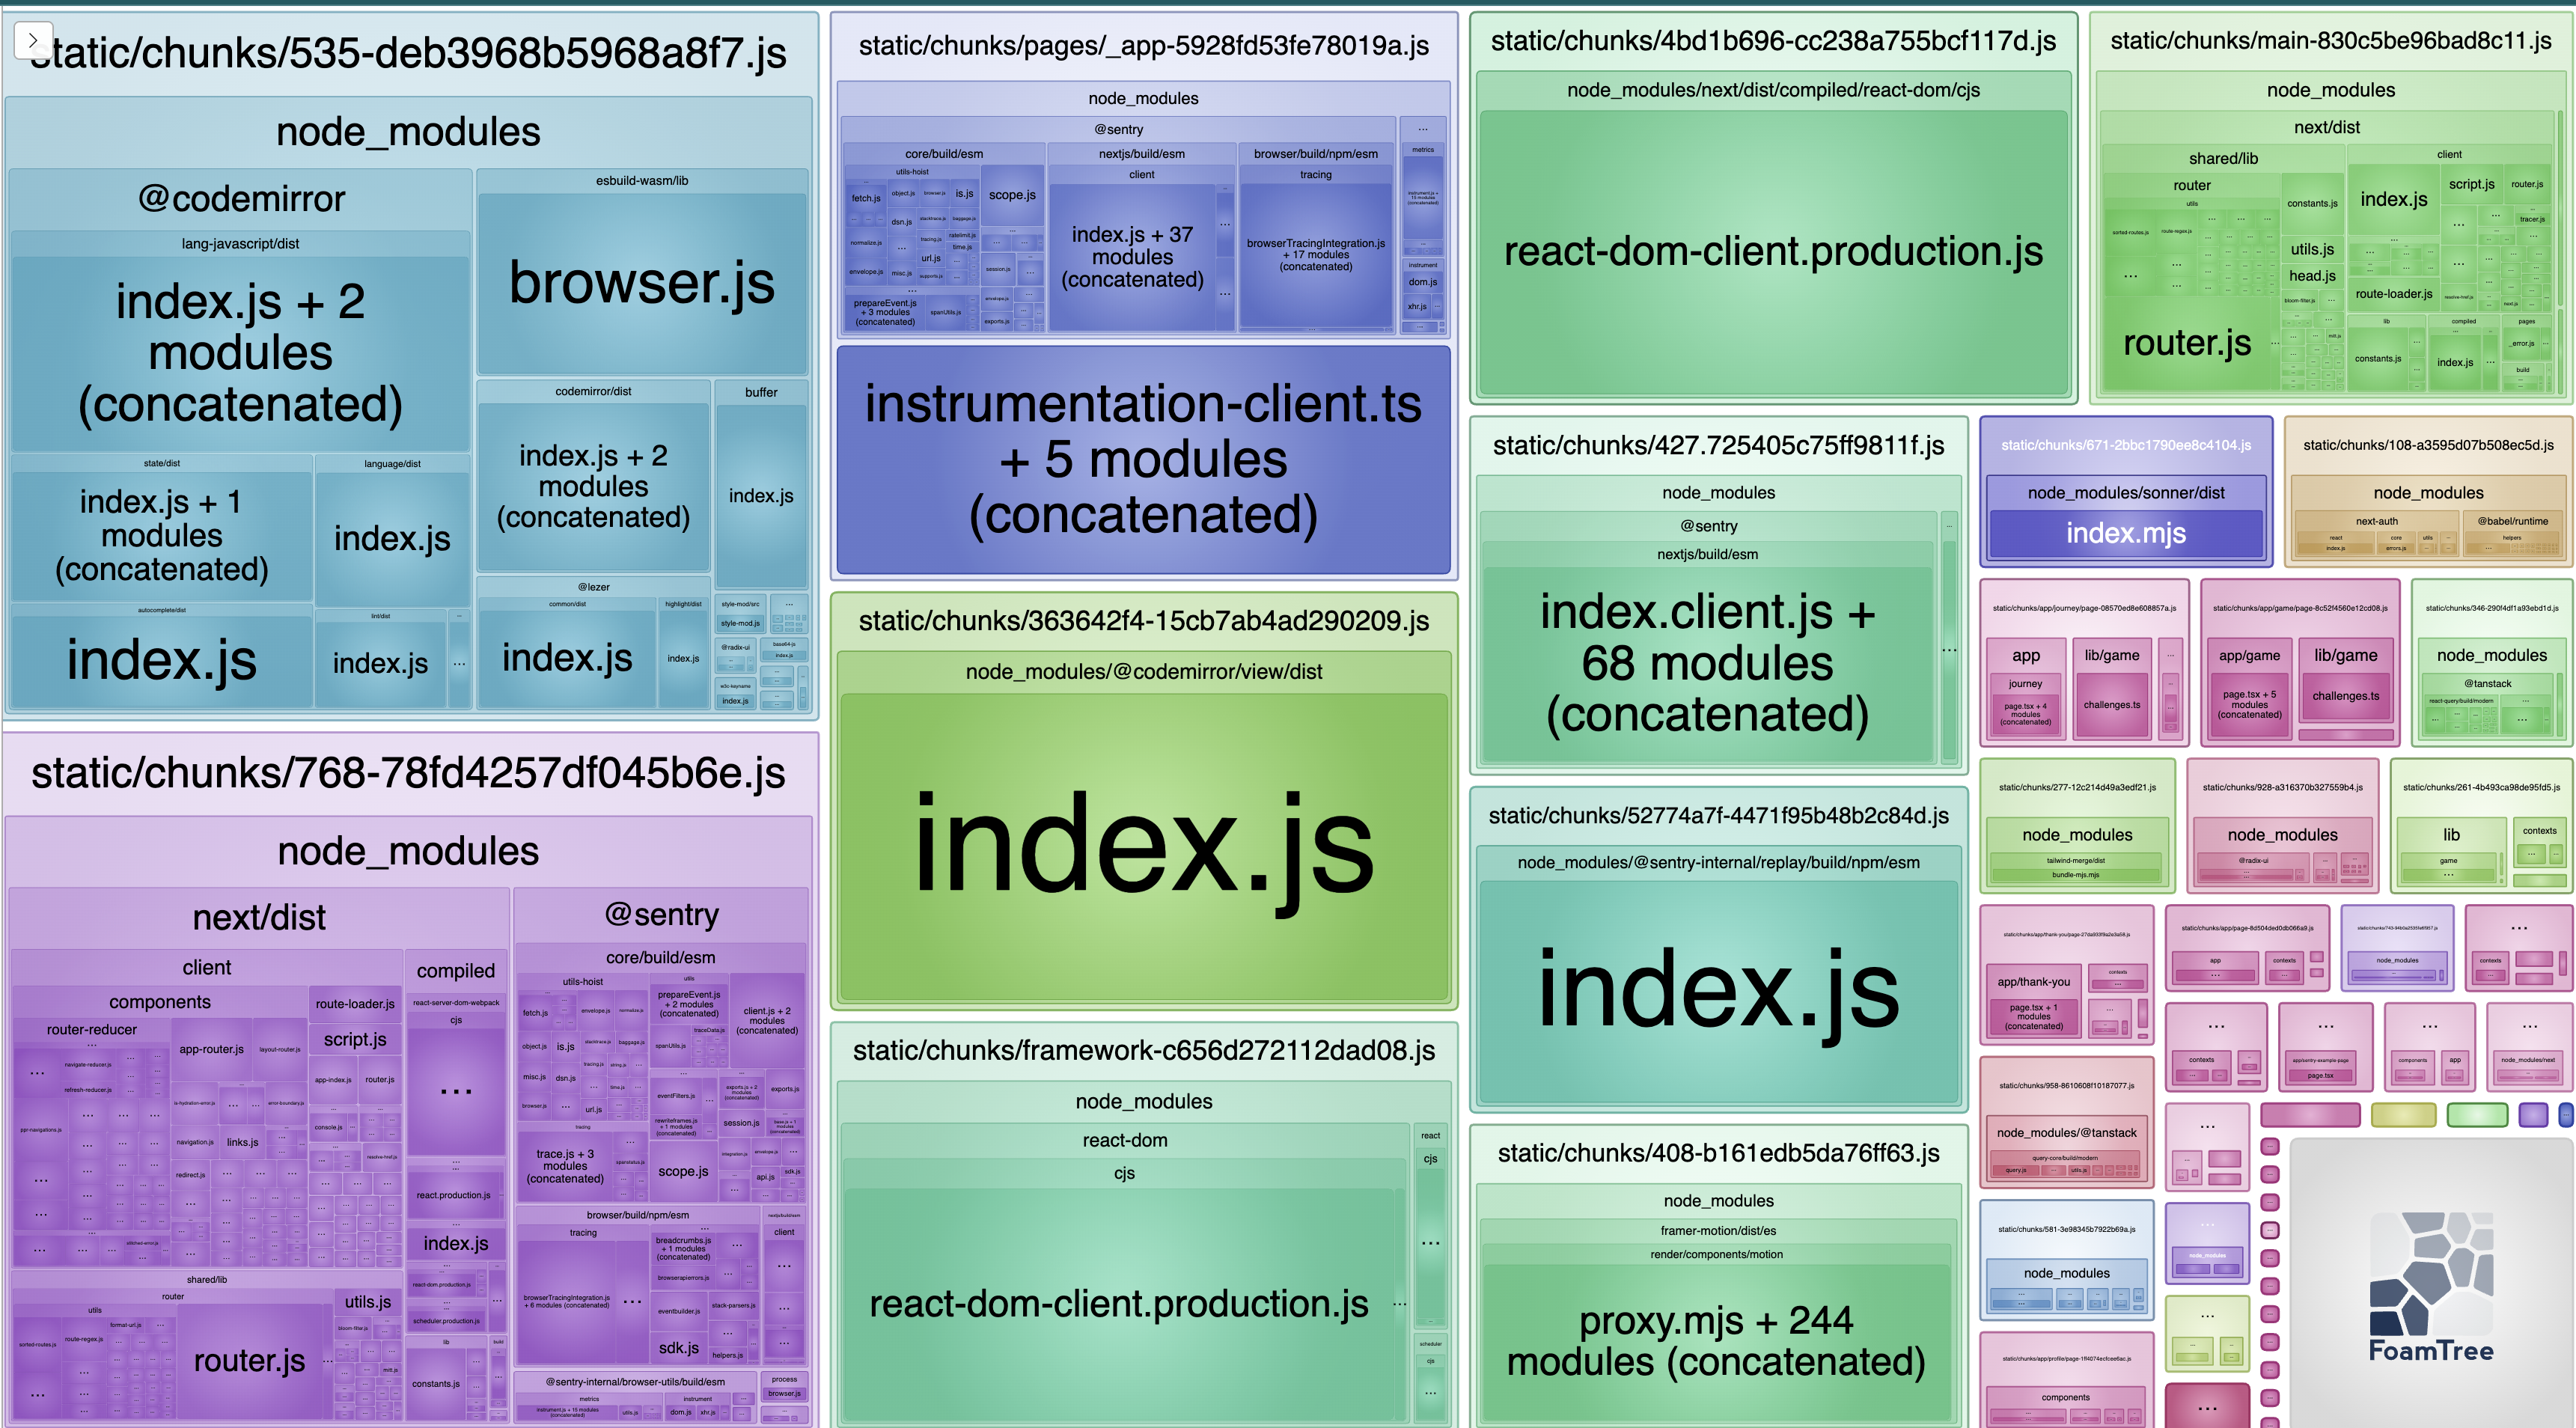
After: Smaller chunks, lazy-loaded assets
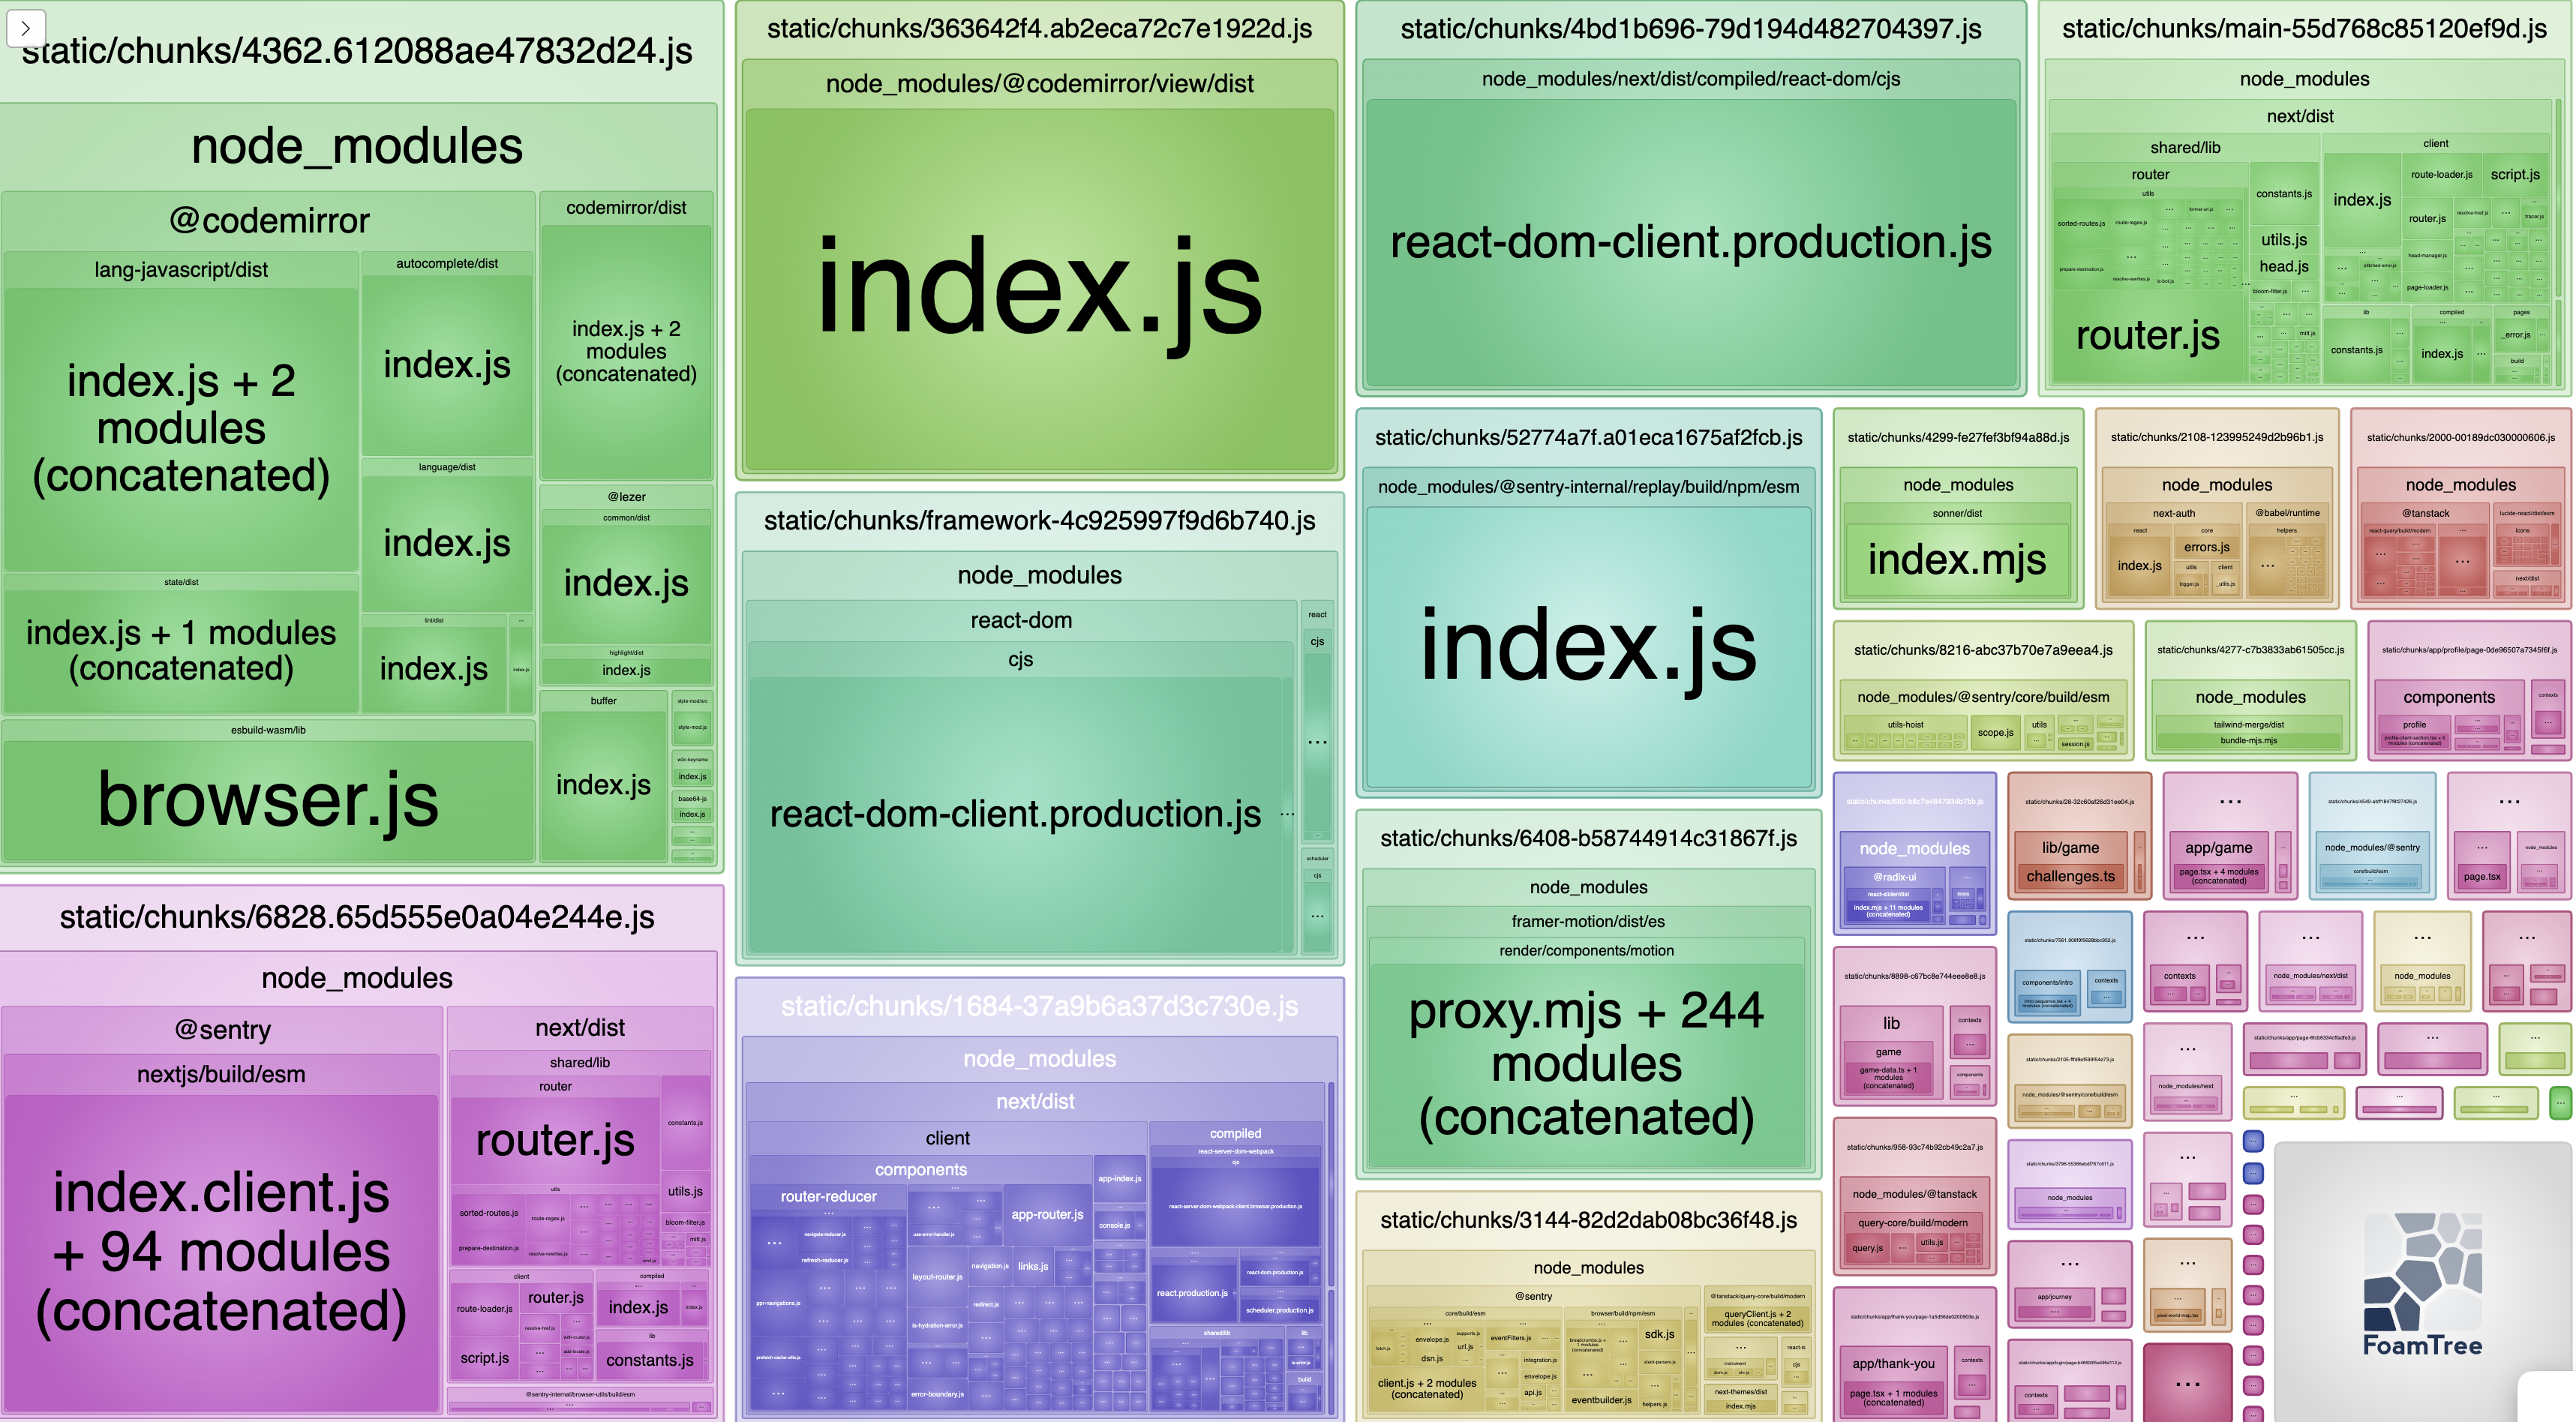
How to Read the Bundle Analyzer Images (Before vs After)
Each colored block in the image represents a JavaScript file your app sends to the browser. The bigger the block, the more code is inside.
Look at the top-left blocks (CodeMirror):
Before: In the first image, @codemirror takes up a huge portion of the top-left chunk (535-...js). That means the editor code was bundled into the initial load, even if the user didn’t need it yet.
After: In the second image, that same @codemirror block now lives in a chunk called 4362-...js, which is still big — but it's now separated. This shows it's being lazy-loaded (only fetched when the user actually uses the editor).
💡 Pro tip: Upload the a screenshot to ChatGPT (or your preferred AI tool) for a faster, in-depth analysis.
Bonus Tools I Use Occasionally
5. Sentry (With Performance Monitoring)
Once Sentry was optimized, I used it to track:
- Real user performance issues
- Component load times
- Navigation and route change delays
It’s great for catching bugs in the wild—especially on slow devices.
6. WebPageTest + PageSpeed Insights
These tools let you:
- Test your site on real devices (not just emulators)
- See how your site performs on slow networks
- Confirm that your local changes help actual users
Tool Stack Recap
Here's the full beginner-friendly HTML table with links and simplified descriptions:
| Tool | What It’s Good For |
|---|---|
| Lighthouse | Gives you an overall score and easy-to-follow tips to make your site load faster. |
| DevTools Performance Panel | Helps you find what’s slowing your page down—JavaScript, layout rendering, or network delays. |
| React Profiler | Shows how long each React component takes to render and helps spot components that render too often. |
| @next/bundle-analyzer | Visualizes which parts of your JavaScript code are taking up the most space in your app. |
| Sentry | Tracks real users and helps you find errors or slowdowns that happen after your app is live. |
| WebPageTest | Lets you test your site on real devices and slower connections to see how it performs for actual users. |
| PageSpeed Insights | Google’s tool for checking how fast your site loads and how to improve it based on real-world data. |
Try It Yourself
Here’s a simple checklist to get started:
- [ ] Run Lighthouse in Incognito mode
- [ ] Simulate
Slow 3Gin DevTools → Network tab - [ ] Record a Performance trace and inspect long tasks
- [ ] Install React DevTools and check for hydration issues
- [ ] Add
@next/bundle-analyzerand run a build to explore bundle size - [ ] Lazy-load one large component with
next/dynamic
Each one of these steps taught me something. You don’t need to do them all at once—just start with one.
Final Thoughts
You don’t need fancy enterprise tools to make your app feel fast. Just by using the browser and a few open-source packages, I brought my app’s TBT down by over 70%.
If you're new: start with Lighthouse. Click around DevTools. Run bundle-analyzer once. You’ll learn so much by just exploring.
The takeaway? Even small apps can feel slow—but they also improve fast with the right tools and a curious mindset.